How to Measure Decision Quality: 5 Metrics That Actually Work
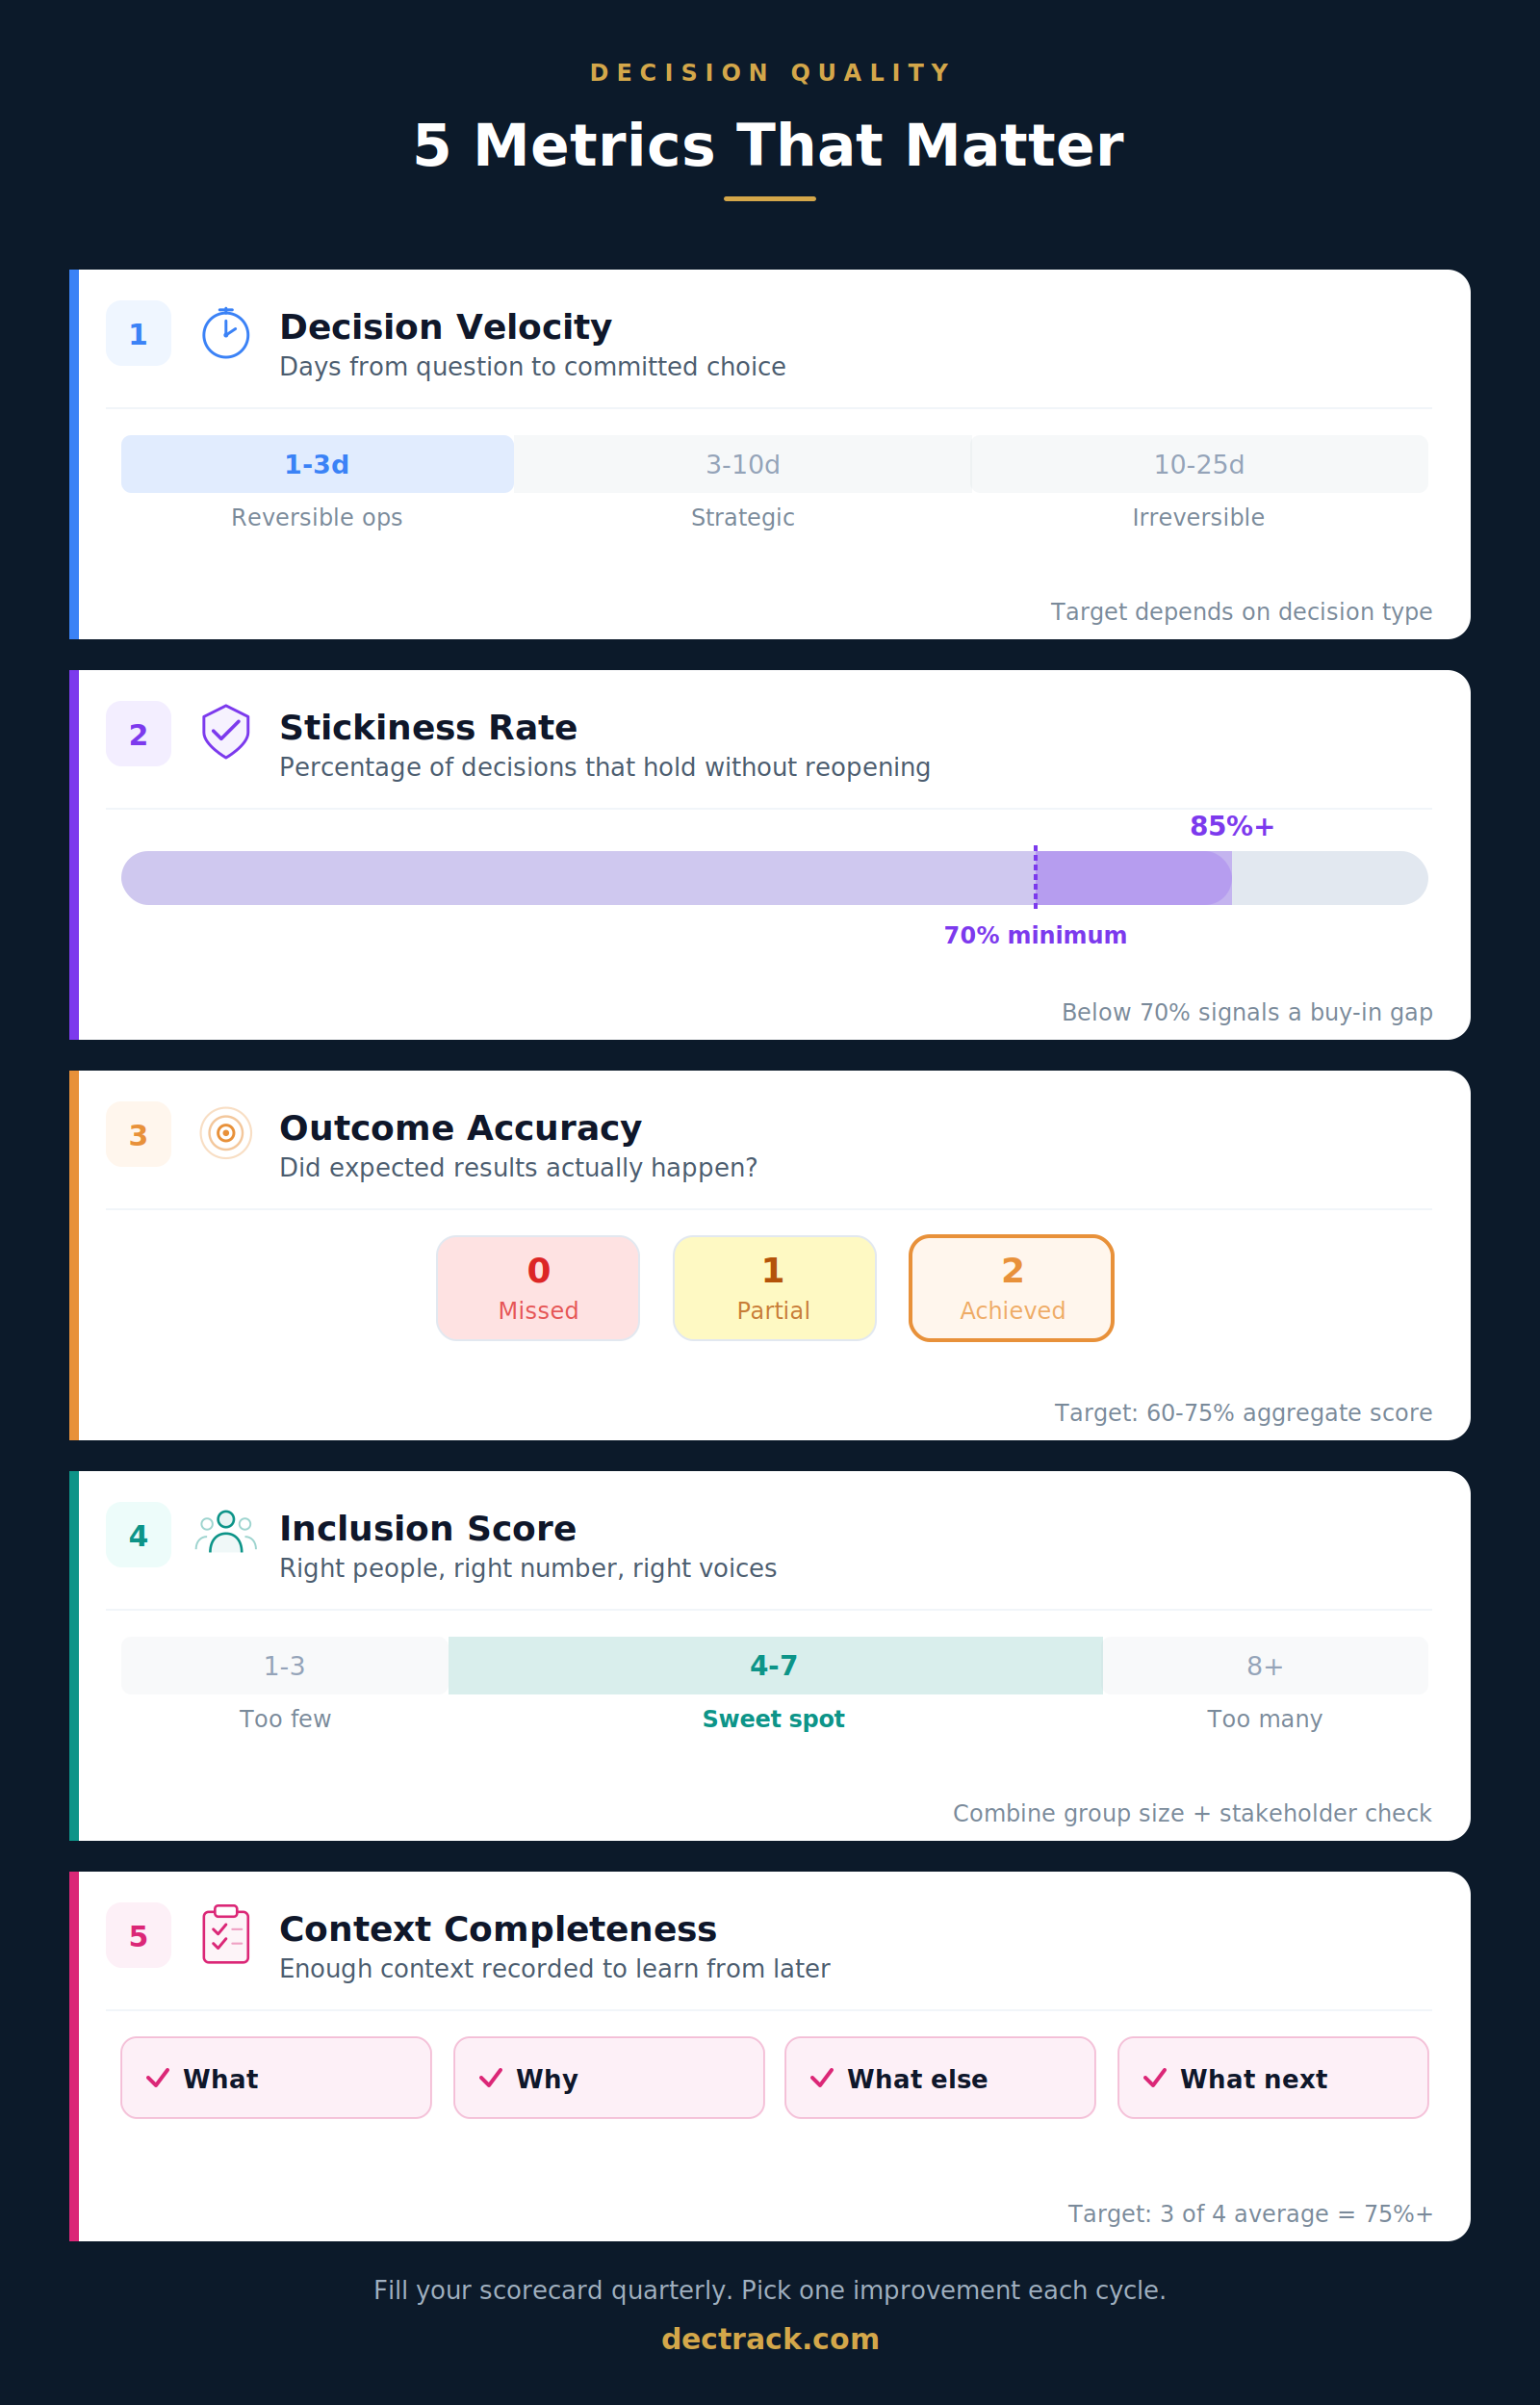
Five concrete, measurable indicators for decision quality: Decision Velocity, Stickiness Rate, Outcome Accuracy, Inclusion Score, and Context Completeness. With scoring methods, worked examples, and a ready-to-use quarterly scorecard.

You track revenue. You track sprint velocity. You track customer satisfaction scores, onboarding conversion rates, and probably a dozen other things that matter to your business. But when was the last time you measured whether your team's decisions were actually good?
If the answer is "never," you are in excellent company. Most teams make hundreds of decisions every year and have zero data on how those decisions turned out. They optimize everything except the thing that drives everything else: their choices.
This guide gives you five specific, measurable indicators for decision quality. Not theory. Not abstract principles. Five things you can start tracking this week, with concrete scoring methods, worked examples, and a ready-to-use scorecard that turns vague "we should decide better" conversations into precise, actionable insights.
Free tool for this article:
→ Free Decision Log Tool – Track context, options, rationale, and next steps
The measurement gap: why decision quality stays invisible
Teams measure the outcomes of their work obsessively. Revenue went up or down. The feature shipped on time or late. The customer renewed or churned. But those are outcome metrics. They tell you what happened, not why.
The "why" almost always traces back to a decision. Someone chose to prioritize that feature. Someone decided to restructure the team. Someone picked that vendor. And yet, when the outcome disappoints, teams rarely examine the decision itself. They examine the execution, the market conditions, the timing. The decision? That is treated as a fixed point in the past, not as something that can be studied and improved.
This creates a blind spot. A team that never examines its decisions will repeat the same patterns, good and bad, without understanding either one.
Decision researchers call this the process-outcome distinction. The Stanford Decision Quality framework, developed by Ronald Howard in the 1960s, makes the separation explicit: a decision has quality at the moment it is made, based on the process that produced it, independent of what happens afterward.
A well-reasoned decision can lead to a disappointing result because markets shift, competitors surprise, or assumptions turn out to be wrong despite solid evidence. That is not a bad decision. That is uncertainty doing what uncertainty does. Conversely, a rushed, uninformed decision can occasionally produce a great result. That is not a good decision. That is luck.
If you only judge decisions by results, you punish teams that made excellent calls but hit bad luck, and you reward teams that got lucky despite a weak process. Over time, you optimize for chance instead of skill.
The five metrics below measure the decision process itself. They give you a way to learn from every decision, not just the ones with obvious outcomes.
The five metrics
Each metric includes what it measures, a concrete scoring method, an example with real numbers, and guidance on interpreting results. Together, they form a complete picture of how your team decides.
Metric 1: Decision Velocity
What it measures: The elapsed time from when a decision question first surfaces to when a clear, communicated choice is locked in.
Note: Our Speed vs. Quality guide explores how to improve decision speed with guardrails and timeboxing. This section focuses specifically on how to measure it, establish baselines, and spot patterns.
How to score it:
For each decision, record two dates: the date the topic first appeared (in a meeting, a Slack thread, an email, or on an agenda) and the date the final decision was communicated. The difference in calendar days is your Decision Velocity for that item.
Then categorize each decision by type. A useful classification:
| Category | Description | Target |
|---|---|---|
| Reversible operational | Can be undone easily, low stakes | 1 to 3 days |
| Reversible strategic | Can be undone but affects broader plans | 3 to 7 days |
| Irreversible operational | Cannot easily be undone, moderate stakes | 5 to 10 days |
| Irreversible strategic | Major commitment, high stakes | 10 to 25 days |
A product team records 15 decisions in January. When they calculate Decision Velocity by category, they find:
- Reversible operational decisions: average 1.5 days (healthy)
- Reversible strategic decisions: average 12 days (too slow, target is 3 to 7)
- Irreversible decisions: average 6 days (possibly too fast for high-stakes calls)
The pattern is clear: this team agonizes over medium-stakes decisions but rushes the big ones. That is a common and dangerous pattern. Knowing it exists is the first step to fixing it.
What to watch for: Decision Velocity is most valuable when tracked by category over time. A single number ("our average decision takes 8 days") hides more than it reveals. The insight comes from seeing which types of decisions move at the right speed and which do not.
Metric 2: Stickiness Rate
What it measures: The percentage of decisions that remain in effect without being reopened, reversed, or substantially modified within a defined period (typically 90 days).
Note: Our guide on preventing decision reopening covers techniques to make decisions stick. This section focuses on measuring the pattern so you know where to apply those techniques.
How to score it:
At the end of each quarter, review all decisions made during the previous quarter. For each one, mark whether it was:
- Held: The decision remained in effect as originally made
- Modified: The decision was adjusted but not fundamentally changed
- Reopened: The decision was revisited from scratch or reversed
Stickiness Rate = (Held x 1.0 + Modified x 0.5 + Reopened x 0) / Total decisions x 100
A Held decision scores 1.0. A Modified decision scores 0.5. A Reopened decision scores 0. This weighted approach gives you a more nuanced picture than a simple "reopened yes/no."
A team made 20 decisions in Q1. In their Q2 review, they find:
- 14 Held (14 x 1.0 = 14)
- 4 Modified (4 x 0.5 = 2)
- 2 Reopened (2 x 0 = 0)
Weighted Stickiness Score: 16 / 20 = 80%
That is a healthy result. But when the team looks at which decisions were reopened, they notice both involved the same pattern: a budget-related decision where the finance team was not included in the original discussion. That is an actionable insight, not about "making better decisions" in the abstract, but about a specific gap in stakeholder involvement for a specific type of decision.
Benchmark ranges:
| Score | Interpretation |
|---|---|
| 85% or above | Strong. Decisions land well. |
| 70% to 84% | Normal. Some friction, worth examining the modified/reopened cases. |
| Below 70% | Significant issues with buy-in, communication, or documentation. |
What to watch for: When you tag reopened decisions with the reason (new information, missing stakeholder, poor communication, changed circumstances), patterns emerge fast. Most teams find that 80% of their reopenings come from just one or two root causes.
Metric 3: Outcome Accuracy
What it measures: How often the expected outcome of a decision actually materialized, scored on a three-point scale.
This is the metric that connects decision quality to real-world results. It is also the one that requires the most patience, because outcomes take time to unfold.
How to score it:
At the moment of making a decision, write down a specific, testable expectation. Not "this will improve things" but "we expect this to reduce support tickets by 20% within 8 weeks." Include a review date.
When the review date arrives, score the outcome:
| Score | Meaning |
|---|---|
| 2 | Achieved: outcome met or exceeded expectation |
| 1 | Partially achieved: outcome moved in the right direction but fell short |
| 0 | Missed: outcome did not materialize or went in the wrong direction |
Outcome Accuracy = (Sum of all scores / Maximum possible score) x 100
A team reviews 8 decisions from Q1 in their Q3 review:
- 3 decisions scored 2 (achieved)
- 3 decisions scored 1 (partially achieved)
- 2 decisions scored 0 (missed)
Total score: 6 + 3 + 0 = 9. Maximum possible: 8 x 2 = 16.
Outcome Accuracy: 9 / 16 = 56%
That is below the healthy range (60 to 75%), so the team digs in. Both missed decisions were hiring-related: the team consistently underestimated how long recruiting takes. That insight leads to a concrete process change: add a 30% buffer to all future recruiting timelines.
Important nuance: A low Outcome Accuracy does not automatically mean poor decisions. A team making bold bets in uncertain territory will naturally have more misses. The value of this metric is not the absolute number but the patterns it reveals over time. Are there categories of decisions where you consistently miss? That is where your team's judgment needs sharpening.
What to watch for: The expectations you write down are as important as the scores. If expectations are vague ("this will help"), you cannot score meaningfully. If expectations are overly precise ("exactly 23.5% improvement"), you set yourself up for unnecessary misses. Aim for specific and realistic: a clear direction, a rough magnitude, and a timeframe.
Metric 4: Inclusion Score
What it measures: Whether the right people were involved in each decision, scored across two dimensions: group size and stakeholder coverage.
Research on group decision-making consistently points to a sweet spot of 4 to 7 people for most team decisions. Fewer than that and you risk blind spots. More than that and the process slows down without meaningfully improving outcomes. But size alone is not enough. A group of seven people from the same department will miss things that a smaller, more diverse group would catch.
How to score it:
For each decision, answer two questions:
Question 1: Was the group size appropriate?
- 4 to 7 people actively involved: score 2
- 2 to 3 people (small but reasonable for the scope): score 1
- 1 person or 8+ people: score 0
Question 2: Were the key stakeholders included?
Identify who is most affected by the outcome. Were they in the room (or the thread, or the document)?
- All key stakeholders included: score 2
- Most included, one notable gap: score 1
- Key stakeholders missing: score 0
Inclusion Score = (Q1 + Q2) / 4 x 100
A team reviews their last 10 decisions:
| Decision | Group size | Stakeholder | Score |
|---|---|---|---|
| Pricing change | 2 (5 people) | 2 (sales, product, finance all present) | 100% |
| Hiring priority | 1 (3 people) | 0 (hiring manager not involved) | 25% |
| Tech stack choice | 0 (9 people) | 2 (all relevant engineers present) | 50% |
| Feature prioritization | 2 (6 people) | 1 (customer success missing) | 75% |
Average Inclusion Score across all 10: 68%
The pattern: this team tends to over-include on technical decisions (too many people) and under-include on people decisions (missing the hiring manager). Both patterns are fixable with simple process tweaks.
What to watch for: The Inclusion Score is especially revealing when cross-referenced with Stickiness Rate. Decisions with low Inclusion Scores tend to get reopened more often. If your data confirms that pattern, you have a strong argument for wider involvement on certain decision types.
Metric 5: Context Completeness
What it measures: When a decision is recorded, does the entry contain enough information for someone (including your future self) to understand what was decided, why, and what was expected to happen?
This is the foundation metric. Without it, the other four become difficult or impossible to measure. You cannot calculate Outcome Accuracy if you never wrote down what you expected. You cannot assess Inclusion Score if you did not record who was involved. You cannot identify Stickiness patterns if the original reasoning is lost.
How to score it:
Rate each recorded decision on four elements:
| Element | Present? | Score |
|---|---|---|
| The decision itself (what was chosen) | Yes/No | 1 or 0 |
| The reasoning (why this option) | Yes/No | 1 or 0 |
| Alternatives considered (what else was on the table) | Yes/No | 1 or 0 |
| Expected outcome with timeline (what should happen and by when) | Yes/No | 1 or 0 |
Context Completeness = sum / 4 x 100
Benchmark ranges:
| Average score | Interpretation |
|---|---|
| 75% to 100% | Strong. Your decision records are genuine learning tools. |
| 50% to 74% | Functional. You capture the basics but miss reasoning or alternatives. |
| Below 50% | Fragile. Most entries are just "we decided X" with no context. |
A team audits their last 12 decisions:
- 3 entries have all four elements (score: 100%)
- 5 entries have the decision and reasoning but no alternatives or expected outcome (score: 50%)
- 4 entries only record what was decided (score: 25%)
Average Context Completeness: 54%
The team is capturing what they decide, but they are routinely skipping the alternatives and expected outcomes. That means they cannot learn from outcomes (no expectations recorded) and they cannot avoid past mistakes (no alternatives documented). The fix is straightforward: add two lines to every decision record.
What to watch for: Context Completeness tends to correlate with documentation format complexity. Teams with elaborate 10-field templates often score lower than teams with a simple four-line format, because the elaborate template gets skipped entirely. Keep it simple: what, why, what else, what next.
The Decision Quality Scorecard
Here is how all five metrics come together into a single, quarterly scorecard:
| Metric | Healthy range |
|---|---|
| Decision Velocity | Varies by category (see table above) |
| Stickiness Rate | 70% or above |
| Outcome Accuracy | 60 to 75% |
| Inclusion Score | 65% or above |
| Context Completeness | 75% or above |
Track these quarterly. The absolute numbers matter, but the trend matters more. A team at 55% Outcome Accuracy that is climbing quarter over quarter is in a better position than a team stuck at 65%.
Running a decision quality review: step by step
The scorecard is most useful when reviewed in a structured 30-minute session. Here is a format that works:
Preparation (5 minutes before the meeting):
Pull your decision log for the quarter. Count how many decisions you recorded. Note any obvious patterns you spotted while reviewing.
Part 1: Score the metrics (10 minutes)
Walk through each metric. You do not need to score every single decision. A representative sample of 8 to 12 decisions per quarter is enough to reveal patterns.
Part 2: Identify patterns (10 minutes)
Look at the scores together and ask:
- Which metric improved? What changed in our process that might explain it?
- Which metric declined? What happened?
- Are there specific decision types (hiring, product, budget, technical) where we consistently score lower?
- Do any two metrics correlate? (Low Inclusion often predicts low Stickiness. Low Context Completeness often predicts low Outcome Accuracy.)
Part 3: Pick one improvement (10 minutes)
Choose exactly one thing to change for the next quarter. Not three things. Not a new process. One specific, concrete change. Examples:
- "We will include Finance in every decision with budget impact over 5,000 euros."
- "We will add expected outcomes to every decision record."
- "We will assign a decision owner for all open items within 48 hours."
One improvement per quarter compounds faster than you think. After a year, your team has made four targeted fixes to its decision process, each one informed by real data.
Five mistakes that undermine decision quality measurement
Even teams that commit to measuring decision quality can stumble. These are the most common traps:
1. Treating it as a performance review
2. Measuring too many things at once
3. Setting unrealistic expectations
4. Forgetting to close the loop
5. Using complicated tools too early
A six-month walkthrough: what this looks like in practice
To make the entire process concrete, here is what a team of eight people might experience over their first six months of measuring decision quality.
Month 1: Build the recording habit
The team starts writing down decisions in a shared log. Nothing fancy. They are not scoring anything yet, just capturing what they decide, the reasoning, and what they expect to happen. By month's end, they have 14 entries. Average Context Completeness: 48%. Most entries record the decision and reasoning but skip alternatives and expected outcomes.
Month 2: First review
The team runs its first 30-minute review, examining 6 decisions from month one. Two things surface immediately. First, a decision about reorganizing the support rotation took 16 days even though it was fully reversible. Nobody owned it, so it bounced between three meetings. Second, a vendor selection decision has already been questioned because the operations lead was not involved. The team's one improvement: assign a clear decision owner within 48 hours of a topic surfacing.
Month 3: Patterns start forming
Context Completeness climbs to 62% as the team gets into the habit. Decision Velocity improves on reversible decisions (average drops from 9 days to 4) because clear ownership eliminates the bounce-between-meetings problem.
Month 4: Outcome Accuracy enters the picture
Enough time has passed to review early decisions against their expected outcomes. Of 8 reviewed decisions, Outcome Accuracy is 56%. Both misses were hiring-related: the team consistently underestimates how long recruiting takes. The one improvement: add a 30% time buffer to all hiring plans.
Month 5: Cross-metric insight
The team notices that 3 of its 4 reopened decisions (low Stickiness) also had low Inclusion Scores. The connection is obvious in hindsight: decisions made without affected stakeholders get challenged during implementation. The one improvement: before finalizing any cross-team decision, run a 2-minute stakeholder check ("who will be most affected by this and are they aware of the discussion?").
Month 6: First quarterly scorecard
The team fills out its first complete Decision Quality Scorecard. Context Completeness: 71%. Stickiness Rate: 78%. Decision Velocity: on target for reversible decisions, still slow on strategic ones. Inclusion Score: 64%. Outcome Accuracy: 62%. None of these numbers are spectacular. But every single one is higher than it would have been six months ago. More importantly, the team has made three targeted process improvements, each based on real data, and each one visibly reflected in the scores.
When to upgrade from spreadsheets to a dedicated tool
A shared spreadsheet works well for the first 30 to 40 decisions and the first two or three quarterly reviews. After that, three things start to feel clunky:
- Filtering and pattern recognition. You want to see "all hiring decisions from the last 6 months" or "all decisions where Inclusion Score was below 50%." Spreadsheets can do this but it requires manual setup.
- Review reminders. When you record an expected outcome with a review date, something needs to remind you to actually review it. Spreadsheets do not send reminders.
- Longitudinal trends. Seeing how your scorecard changes quarter over quarter requires building charts manually.
That is the point where a dedicated decision tracking tool pays for itself. DecTrack is built for exactly this workflow: capture decisions with context, assign owners, track who was involved, set review dates, and see how your metrics evolve over time. If your team is ready to move beyond spreadsheets, it is worth exploring.
Closing the loop
Most teams measure everything about their work except the decisions that shape it. Revenue, velocity, satisfaction, conversion: all tracked. But the choices that drive those numbers? Invisible.
The five metrics in this guide make decision quality visible. Decision Velocity shows where your process is fast and where it stalls. Stickiness Rate reveals whether decisions land or get challenged. Outcome Accuracy connects your choices to their real-world results. Inclusion Score catches the missing voices that lead to reopening. Context Completeness ensures you can learn from everything else.
None of this is complicated. None of it requires special training. It requires one thing: the willingness to look back at your decisions with honest curiosity, find the patterns, and make one small improvement at a time.
Teams that do this build a kind of collective decision intelligence that compounds quarter over quarter. Each review sharpens the next decision. Each pattern discovered removes a recurring blind spot. And gradually, "we think we make good decisions" becomes "we know we do, and here is the scorecard to prove it."
Further reading from the DecTrack blog
- Speed vs. Quality: Faster, Better Team Decisions (improving decision speed with guardrails)
- Make Decisions Stick: Prevent Reopening (techniques for higher stickiness)
- Learning From Decisions: Retrospectives and Feedback Loops (the review process in depth)
- Decision Tracking: What It Is and How to Start (building the recording habit)
- Where Do Your Team's Decisions Live? The Scattered Decision Problem (why context gets lost)
- 9 Decision Traps Teams Must Avoid (cognitive biases that distort decisions)
DecTrack
2. March 2026